Have you ever looked at a stock chart and wondered why a tiny candle with a long shadow can make traders so excited? That’s the magic of the inverted hammer pattern — one of the simplest yet most powerful candlestick formations used in trading.
In this guide, we’ll break down its meaning, formation, and how you can use it to make smarter trading decisions. We’ll also explore inverted hammer in uptrend setups and even connect you with trading courses in Bangalore to master the art of technical analysis.
Learn how the inverted hammer pattern, especially the inverted hammer in uptrend, signals trading opportunities. Also find top trading courses in Bangalore.
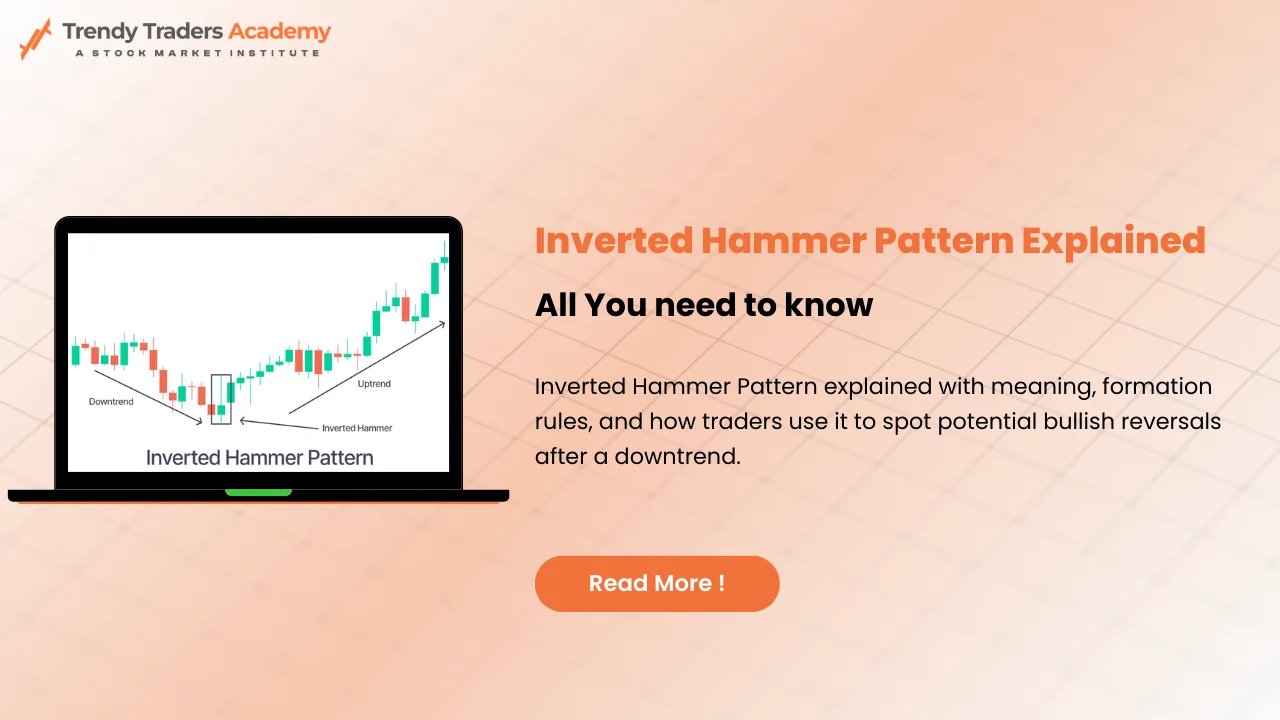
The inverted hammer pattern is a single-candle reversal pattern that typically appears at the bottom of a downtrend. It signals that buyers are starting to push back against sellers — a possible hint that prices may soon rise.
Think of it like a tug of war where sellers have been pulling hard for days. Suddenly, buyers start pulling back, giving a glimpse of strength. The inverted hammer tells you buyers might regain control soon.
An inverted hammer has a distinct look:
This formation resembles an upside-down hammer — hence the name. The upper wick represents the failed attempt of buyers to maintain higher prices during that period, followed by a close near the open, suggesting a potential shift in momentum.
Both patterns look similar, but their positions make all the difference:
| Pattern | Appears In | Market Signal |
| Inverted Hammer | At the end of a downtrend | Bullish reversal |
| Shooting Star | At the end of an uptrend | Bearish reversal |
So, if you spot a candle with a long upper wick after a strong downtrend — it’s a bullish inverted hammer.
Every candlestick tells a story of buyer and seller emotions.
In the case of the inverted hammer, the story goes like this:
This shows that buying pressure is starting to build, hinting that the trend might soon reverse.
When you see an inverted hammer after a long fall, it’s like seeing the first spark after heavy rain — a possible sign of revival.
However, alone it’s not enough. You’ll need confirmation — such as the next candle closing strongly above the inverted hammer’s high — to confirm the reversal.
To correctly identify an inverted hammer:
Many charting platforms like TradingView, MetaTrader, or ThinkorSwim make spotting these patterns easy with built-in candlestick scanners.
Yes, an inverted hammer in uptrend can appear too — but its meaning flips.
When it appears during an uptrend, it acts more like a warning than a signal. It indicates that even though buyers pushed prices high, sellers entered aggressively to pull it back down.
In such a case, it may hint at a potential slowdown or a trend exhaustion rather than a reversal.
Here’s a simple approach:
This strategy suits swing traders and short-term investors who rely on chart patterns and price action.
Always confirm before you act. Some common confirmation methods include:
These help validate the candle’s bullish promise and protect you from false signals.
Even experienced traders can misread this pattern. Beware of these pitfalls:
Remember, even the strongest signals can fail. The key is to pair patterns with a well-defined trading plan.
To enhance accuracy, combine the inverted hammer with:
When multiple factors line up with an inverted hammer, your trade has a much better chance of success.
Let’s take an example:
During a market dip, a stock like Tata Motors formed an inverted hammer on its daily chart after multiple red candles. The next day, a strong bullish candle appeared — confirming reversal. Over the following week, the price rallied by over 5%.
This shows the importance of combining pattern recognition with confirmation.
If you’re serious about learning these patterns, Bangalore is a hub of trading education. Some reputed trading courses in Bangalore include:
Each of these institutions can help you build a strong technical foundation to recognize and act on signals like the inverted hammer pattern effectively.
Learning from experts saves time and prevents costly errors. Courses on trading psychology, risk management, and chart analysis teach how to:
Candlestick mastery isn’t about memorizing shapes — it’s about understanding price behavior.
The inverted hammer pattern may look simple, but its implications are deep. It captures a turning moment when buyers begin to reclaim control.
However, always combine it with confirmations and risk management. Like any trading tool, its success lies in how wisely you use it, not how often you spot it.
Whether you’re a beginner learning through trading courses in Bangalore or a self-taught trader, understanding patterns like the inverted hammer in uptrend or reversal setups can sharpen your market edge.